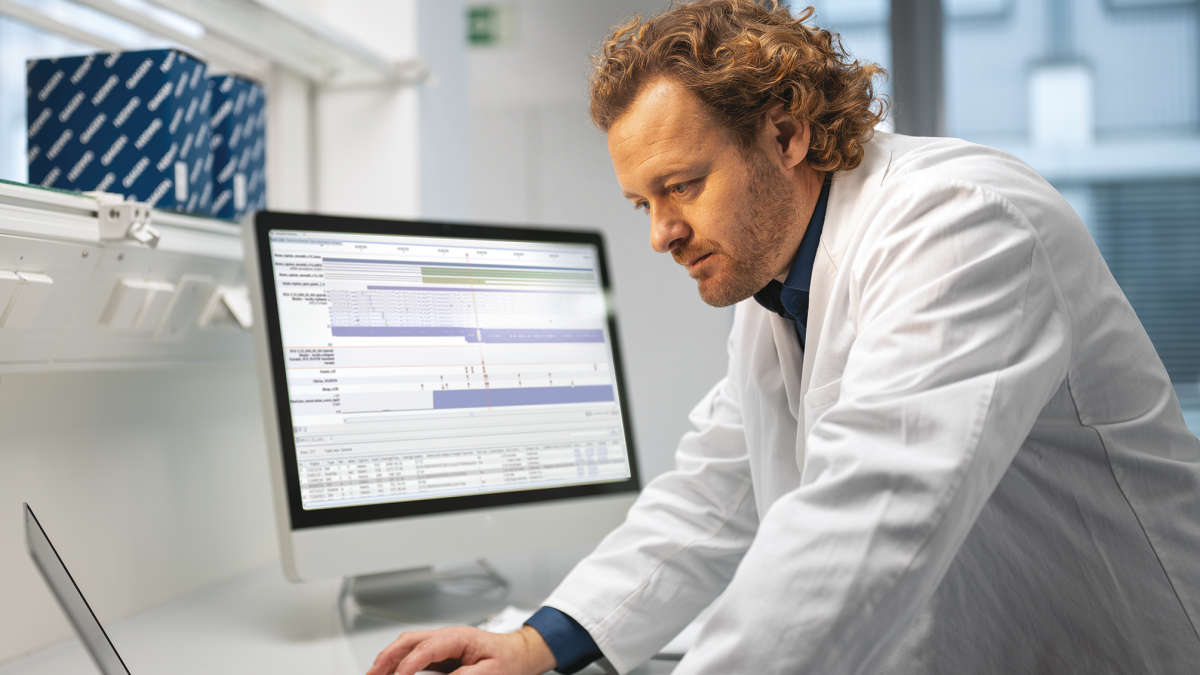


A slide illustrating some of the many result types/graphics you will be able to generate after this training.
https://qiagen.showpad.com/share/jYTCDPNfz1SdIMPQPSPYS
Description: In this training, you will learn how to analyze and interpret your own single-cell RNA-seq data using QIAGEN CLC Genomics Workbench, starting with either FASTQ or matrix files.
Using CLC Genomics Workbench, you will learn how to perform secondary analysis on your single-cell RNA-seq data. Specifically, you will learn how to:
• Import your raw FASTQ or processed cell-matrix files
• Use pre-configured but customizable pipelines/workflows for single-cell RNA-seq data
• Generate high-resolution visuals and other files from your analysis for publications and biopharmaceutical discoveries
o Dimension reduction (UMAP, t-SNE) plots
o Differential expression tables for clusters, cell types, or a combination of both
o Heat map
o Dot plots
o Violin plots
• Learn how to use “Create Cell Annotations from Hashtags” for cell hashing, as with CITE-seq
• Dive into spatial transcriptomic analysis, the latest feature in the single-cell RNA-seq module
This 120-minute training will teach you how to easily analyze and interpret RNA-seq data using QIAGEN CLC Genomics Workbench software and QIAGEN Ingenuity Pathway Analysis (IPA).
For RNA-seq data, you will learn how to:
• Import FASTQ files, cell matrix files and metadata and how to download references
• Map reads to a reference genome and generate gene and transcript counts and QC reports displaying % mapped reads, knee plots, etc.
• Generate visualizations of results, such as heatmaps, differential expression tables, PCA/PCOA plots, Venn diagrams and others
• Easily customize RNA-seq workflows
• Export publication-quality graphics, tables and reports
• Send differential expression tables to QIAGEN Ingenuity Pathway Analysis directly from QIAGEN CLC Genomics Workbench to analyze and interpret relevant pathways
Explore the types of analyses and visualizations you’ll learn to generate (slides from previous training): https://qiagen.showpad.com/share/qiZLmCUS32GZNM1B4llMf
Do you ever struggle to formulate hypotheses based on your experimental expression data? You may be comparing results from healthy versus tumor cell lines or treated versus untreated samples. What do the differences between expression patterns in the data mean? Many of us struggle to make biological sense of our RNA-seq or microarray data. The massive amount of expression data generated from experiments leaves us with thousands of data points but often no understanding of their biological meaning.
Advanced pathway analysis is an excellent way to gain a deeper understanding of expression data and experimental results. Here we offer three easy ways to go from expression data to pathway analysis so you can give your experimental data biological context to start gathering meaningful insights.
QIAGEN Ingenuity Pathway Analysis (IPA) is a popular tool for analyzing, comparing and contextualizing differential gene expression results from experiments in human, mouse or rat, among other organisms. QIAGEN CLC Genomics Workbench has convenient tools for processing raw data from RNA-seq or microarray experiments and performing differential gene expression analysis. In addition, with an IPA license and the Ingenuity Pathway Analysis Pathway plugin installed, you can upload results to IPA directly. By combining QIAGEN CLC Genomics Workbench with QIAGEN IPA, we offer a versatile platform for linking various instrument readout formats to biological insights.
These are the three most common use cases we see among our customers:
Use case 1: FASTQ data to IPA
Typical experiments you may be running involve sending RNA (mRNA, miRNA, lncRNA, etc.) from treatment and control samples to an NGS sequencing facility. After sequencing, you perform bioinformatics analysis using QIAGEN CLC Genomics Workbench on the FASTQ file(s) returned by the facility. First, you can do QC and trimming using the Prepare Raw Data workflow. Samples that meet QC criteria are then associated with metadata describing the experimental setup. You can identify differentially expressed genes (DEGs) using the RNA-Seq and Differential Gene Expression Analysis workflow. Differential gene expression analysis is based on the fit of a Generalized Linear Model with a negative binomial distribution, like the approaches taken by the popular tools EdgeR (Robinson et al., 2010) and DESeq2 (Love et al., 2014). Paired designs are supported, and it is possible to control for batch effects. You can then upload DEGs directly to IPA for additional analysis, comparison and contextualization. Analyze Expression Data and Upload Comparisons to IPA provides a convenient Sample to Insight workflow.
See also our manual on RNA-seq and small RNA analysis.
Use case 2: RNA-seq expression data to IPA
In this use case, the sequencing facility processes the raw FASTQ files and returns an expression matrix file, which takes up much less space than FASTQ files do. You can import expression matrices using the Import Expression Matrix tool in QIAGEN CLC Genomics Workbench. Then you can apply QC criteria, associate metadata and compare the experimental groups as described for use case 1. This use case is also supported by a Sample to Insight workflow: Analyze Count Matrix and Upload Comparisons to IPA.
Use case 3: Microarray expression data to IPA
In this third scenario, the samples have been processed on microarrays, not using NGS. Various generic and vendor-specific formats are supported in QIAGEN CLC Genomics Workbench. Steps include setting up a microarray experiment to group the samples, followed by transforming and normalizing the expression data and running a statistical test to identify differential expression. Several tests are available, including proportion-based tests, t-tests and ANOVA. Filtered DEGs can be uploaded to IPA for pathway analysis as described for use case 1.
Ready to give it a try?
QIAGEN Digital Insights bioinformatics tools for transcriptomics support microarray and RNA-seq data analysis with a variety of specialized tools. They enable you quickly go from raw instrument output to biological insights, as well as compare to over 100,000 curated public datasets. Learn more and request a consultation about our portfolio of tools for biomarker and target discovery that support expression data analysis. Ready to try these applications? Request a trial of QIGEN CLC Genomics Workbench and QIAGEN IPA to see how these tools can work together to streamline your insights from expression data.
References:
Resources:
Plugin:
Blogs:
Best practices for RNA-seq data analysis
Compare biological expression results with QIAGEN IPA Analysis Match
Webinars:
Training on RNA-seq and pathway analysis
Example analysis performed using QIAGEN CLC Genomics Workbench:
Tutorials:
Expression analysis using RNA-Seq data
Advanced RNA-seq analysis with upload to IPA
Microarray-based expression analysis
Building workflows in QIAGEN CLC Genomics Workbench video tutorials
How to include external applications to QIAGEN CLC Genomics Server video tutorials
Do you spend hours cleaning up and integrating ‘omics data, yet still feel like you are drowning in it?
‘Omics data is a powerful resource to help drive innovation in biomarker and target discovery. If you work in drug development, you probably explore potential therapies by using ‘omics data to find new targets and indications. Yet it can be daunting to process, integrate and clean the data to make it meaningful. You’re probably working with data from both public portals and your internally-generated sources, each with its own sets of metadata and respective vocabularies. Perhaps it comes from several different drug discovery programs representing various diseases. The sheer volume and heterogeneity within ‘omics datasets can create a discouraging barrier to drawing meaningful conclusions.
Boost your bioinformatics capabilities
Have you ever thought of seeking the expertise and services of an experienced bioinformatics team to extend and speed up your ‘omics data processing capabilities?
QIAGEN Discovery Bioinformatics Services has the tools, knowledge and resources to help you quickly unravel the biology hidden in your ‘omics data. We supplement your workforce with experts from our bioinformatics team, including Ph.D.-qualified scientists, developers and project managers to provide a customized solution for your project. We do everything from secondary analysis services to in-depth analysis of biological data. We also take on high-quality content curation of literature, datasets and pathways. We can even build custom databases, which are specific collections of integrated ‘omics data with manually curated metadata.
Our services team helps biologists and bioinformaticians like you quickly answer questions relevant to your biomarker and target discovery projects. We do this by using our state-of-the-art software tools and high-quality manually curated content to query your ‘omics data to help answer your hypothesis-generating questions, such as:
Once we run these queries, we can perform deeper meta-analyses on data collections to help you make more accurate hypotheses based on the biological context. Our queries and analyses save you countless hours organizing and visualizing internal pipelines and results, taking you directly down the biological path that makes most sense.
Example service project
A typical transcriptomic project that we take on is processing and storing bulk RNA-seq datasets, including single-cell RNA-seq. Sound familiar? Our QIAGEN Discovery Bioinformatics Services team will create a customized unified pipeline script to process your data and store it in a database framework. We pay special attention to statistical analysis, which can often be tricky when working with transcriptomic data. That’s because this type of data is often generated from heterogeneous samples composed of multiple cell types, and the counts data from a sample represents the average gene expression across all cell types. This heterogeneity is a major hurdle in statistical analysis. Differences in cell type proportions may prevent or bias the detection of cell type-specific transcriptional programs. To manage such challenges, our services team:

Figure 1. Workflow for processing bulk RNA-seq data.
Quickly get the output you need
On all our projects, we work with you to determine the output and deliverables that best fit your needs. A typical example of what we provide for bulk RNA-seq data processing and storing is:
By working with QIAGEN Discovery Bioinformatics Services on projects like bulk RNA-seq data processing, you'll save time and increase accuracy. We help you quickly prioritize drug targets, biomarkers and compounds so you can readily gain a more robust and insightful understanding of complex diseases, to drive your next discovery.
Would you like to reduce the burden of working with ‘omics data to more quickly reach your next biomarker or target discovery? Could you use support with RNA-seq data processing and analysis? Let QIAGEN Discovery Bioinformatics Services lend a helping hand. Learn more about our range of bioinformatics services to extend and scale your in-house resources with our expertise and tailored bioinformatics services. Contact us today at QDIservices@qiagen.com to get your next project started. Together, we'll tame the 'omics data beast.
Dr. Philip James, Ph.D., Senior Researcher at a small research institute called Nofima, was confronted with several challenges associated with access to analytics tools when studying the effect of diet on gene regulation in sea urchins, including processing and pathway analysis of RNA-seq data. He also needed to put the results into a biological context.
Dr. James found partnering with QIAGEN Discovery Bioinformatics Services a reliable and convenient way to extend in-house resources, with our expertise and tailored bioinformatic services ensuring time savings and high-quality results.
Inspirational and groundbreaking science is often unorthodox and tricky, even concerning bioinformatics research. Follow the journey of partnering with QIAGEN Discovery Bioinformatics Services, from initial contact and delivery of data analysis to submission for publication.
The QIAGEN CLC Genomics Workbench now enables analysis of uncorrected long reads from Oxford Nanopore and PacBio using a newly developed plugin that provides seamless integration with other QIAGEN CLC products. The Long Read Support plugin builds on established state-of-the-art pipelines for read mapping, read error correction, de novo assembly and contig polishing that are made available through the user-friendly workbench graphical user interface (GUI). No command-line or code compilation is needed. Benefits of the Long Read Support plugin include:
Find out the details in our scientific poster and learn more about the Long Read Support plugin, QIAGEN CLC Genomics Workbench and QIAGEN CLC Microbial Genomics Module. Learn more about de novo assembly using long reads and short read polishing in this tutorial.
In our recent white paper we describe how to investigate the functional potential of a microbial community in a polar desert in Antarctica using metagenomic shotgun sequencing data. In the original paper (1), the authors supplemented their microbiome data with qPCR analyses to investigate the expression of the most interesting genes discovered in the functional profiles to support their hypothesis that the microbial community survive by scavenging atmospheric trace gases. However, what if they had instead included RNA-seq transcriptomic data to evaluate gene activity in their samples? In this post, we show you how to add transcriptomics data to a microbiome survey using the tools of CLC Genomics Workbench.

The example below presents a de novo assembly based approach to metatranscriptomic analysis using CLC Genomics Workbench and the Microbial Genomics Module. There are, in fact, multiple approaches to performing metatranscriptomics data analysis, depending on the specific questions you may have. For a deeper review on best-practices in metatranscriptomics analysis we recommend you review Bashiardes et. al. (2), or read published examples where CLC Genomics Workbench was used for metatranscriptomics research; some recent interesting examples include a study of thehoney bee (3) and termite (4) microbiomes and their associated metatranscriptomes.
The example metatranscriptomic pipeline presented below consists of two parts (shown in Figure 1). Part 1 includes: assembling the metagenome; grouping contigs into bins to reconstruct the microbial genomes; and finding and annotating genes. It is also described in further detail in our recent white paper on Antarctic microbiome profiling. A common approach and caveat of comparing metatranscriptomes from multiple samples is often to create a “co-assembly” across your samples that serves as a single reference list of contigs and genes for the downstream RNAseq analysis. A good example of this approach can be found in Marynowska et. al. (4).
Part 2 of the analysis pipeline involves adding the transcriptomic data to supplement the metagenomic survey with information on gene activity. Part 2 is the focus of this post and will be described below.
CLC Genomics Workbench include a suite a of tools designed for analyzing gene expression data. For this blog post, we will use just only a few of them. The RNA-Seq Analysis tool will start with mapping reads to the genome and the coding sequences. The tool requires a file with the reference genome and a file with annotations for protein coding sequences (CDS) or genes. If these are not already available from Part 1 of the pipeline (Figure 1), they can be generated using Track Tools -> Track Conversion -> Convert to Tracks. This will take an annotated genome or list of contigs as input and generate individual track files. Additional details on this conversion step can be found in our manual. In this case we need to generate a track for the genome and one for the annotated coding regions. From the read mappings, reads are categorized and assigned, and expression values are calculated. The output from the RNA-Seq Analysis tool is a table describing for each gene the number of reads mapped, the number of reads per kilobase gene, and the expression value. The results can be visualized in a track list along with the genes and the read mappings (Figure 2). The track list is interactively linked to the results table, and marking a CDS of interest in the table view, will shift the focus of the track list to that particular region.

From the track view read mappings can be manually inspected by zooming in on individual genes (Figure 3). In the case of the desert soil microbiome in Antarctica, genes supporting the use of atmospheric trace gases as carbon and energy sources could be searched out from the table, and the expression values inspected.

If your microbiome investigation involves comparing microbial communities at different times or under different conditions, transcriptomes can be compared across multiple states. This analysis can be performed with the tool Differential Expression for RNA-Seq. The tool performs a statistical test of the differential expression of two or more samples. The output is a table displaying for each gene, the fold change and the p-value for the statistical comparison. From this list, genes significantly changing expression levels under different biological conditions can be found.
CLC Genomics Workbench contain several additional tools for analyzing RNA-Seq data for more sophisticated comparisons and visualizations than what have been shown here. If you are interested in learning more or trying out the functionalities, you can always download a free trial.
In an independent comparative study (1), four miRNA NGS library preparation kits from different vendors were assessed. The results showed that the QIAGEN QIAseq miRNA kit was the superior choice on all parameters benchmarked. Here, we discuss bioinformatics support for NGS data generated with this kit through a dedicated miRNA analysis pipeline.
For library preparation quality control, a spike-in kit is available. Although highly recommended, this QC measure is optional. QC based on this kit is performed in the bioinformatics analysis.
The QIAseq miRNA NGS library preparation kit makes use of Unique Molecular Identifiers (UMIs) enabling precise quantification of nucleic acids in challenging samples such as FFPE, plasma and serum, where the analyte often is rare and highly degraded. UMIs are tagged to the captured analyte so that amplification biases and other artifacts of library preparation can be reduced to a minimum.
In this implementation, both Illumina and IonTorrent reads can be used, in conjunction with a metadata table describing the samples. The QIAseq miRNA Quantification ready-to-use workflow allows the quantification of miRNA expression for each sample. An overview of identified miRNAs across all samples can be generated by the Create Combined miRNA Report tool. The QIAseq miRNA Differential Expression ready-to-use workflow then estimates which miRNAs are differentially expressed, using the well-known tools from the RNA-seq workflows. In all steps, options and parameters in the workflow can be freely changed and adjusted.
Contrary to most miRNA bioinformatics analysis pipelines, which first map to the reference genome, the CLC Genomics Workbench QIAseq miRNA workflow first creates UMI consensus reads. Then, it annotates these UMI reads with Small RNA Reference Data. This data set contains the miRbase database, and spike-in sequence information. In the next release, the software will include options for including custom databases (e.g. piRNABank for additional functional miRNA annotation in addition to rRNAs and tRNAs for sources of non-miRNA reads).

Figure 1 Schematic overview of the bioinformatics workflow for the analysis of NGS data generated using the QIAseq miRNA library preparation kit.
In the Grouped on mature expression table, there is a row for each mature miRNA in the database, which gives insights into which specific miRNA genes are regulated.
miRNA seeds are the active agents regulating biological pathways, no matter which member of a family of similar miRNA genes the seed originates from. The Grouped on seed expression table has a row for each identified miRNA seed. This table supports further analysis in Ingenuity Pathway Analysis.
A Heat Map, Venn Diagram, GO Gene Set Test, and Expression Browser are generated to compare miRNA expressions in groups specified in the metadata.
We have reanalyzed the data from Coenen-Stass1 and found that the pipeline described here yields accurate quantification of the miRNAs and increases the fraction of miRNA-annotated reads, as well as increasing the number of detected miRNAs, compared to the findings reported by Coenen-Stass. Also, a reduction in the coefficient of variation was observed. Tailoring and tuning the bioinformatics tasks for the analysis of NGS data from a specific QIAseq kit thus increases the quality of analysis.
Try the miRNA NGS analysis using CLC Genomics Workbench tutorial.
Check out the related QIAGEN liquid biopsy resources featuring exosome research resources and cfmiRNA solutions.
Plugin availability
The Biomedical Genomics Analysis plugin is freely available and can be downloaded and installed directly on the CLC Genomics Workbench via the Plugin Manager. Plugin files can also be downloaded from our plugins webpage for installation on the CLC Genomics Workbench or CLC Genomics Server.
Transcript discovery using RNA-seq is an important step in refining eukaryotic genome annotation by complementing in-silico gene predictions with experimental evidence for genes, transcripts, splice variants, and their expression levels. Best practice is to include evidence from both long- and short-read NGS data, which reduces challenges stemming from inference of transcripts and their splice variants from partial observations or rarely used splice junctions resulting in read-through events.
The new Transcript Discovery Plugin for CLC Genomics Workbench and the CLC Genomics Server allows joint analysis of both long PacBio and short Illumina reads from RNA-seq libraries. The plugin works by mapping RNA-Seq sequencing reads to a genomic reference while permitting large-gap alignments (to account for introns), followed by a transcript discovery process where transcripts and genes are inferred from the read mappings. If genome annotations already exist for the genome at hand, these can be updated based on the experimental evidence from the RNA-seq data, thus generating new transcript and gene annotation tracks.
Central to the Transcript Discovery Plugin is the Large Gap Read Mapping step, which models the presence of introns in the genome reference sequence, but are expected to be absent from the corresponding transcriptome. RNAseq reads are iteratively mapped to the reference genome using the CLC Genomics Workbench read mapper. The Transcript Discovery step then predicts genes, transcripts, and coding regions (CDS) from the read mapping results, while considering prior knowledge on gene and transcript models and the coding potential of predictions. The estimation is also aided by several filters applied to the mapped reads, such that coverage, splice evidence and splice signatures are considered, while duplicated, non-specific matching, read-through and chimeric reads are disregarded.
Rich tables of predicted features with columns describing their various evidences can be viewed as genome tracks and inspected together with the read mappings. Furthermore, examination of the Rejected Events table can lead to insights on filtering settings that can be fine-tuned until sensitivity and specificity are in balance. An example of some of the output from this plugin can be seen in Figure 1.
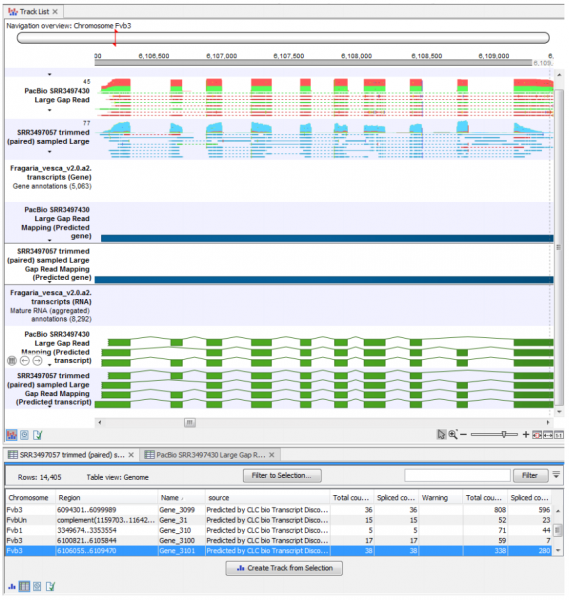
Figure 1: RNA-seq mapping and annotation tracks identified using the Transcript Discovery tool seen in a Track List, with the Predicted Gene annotations opened as a table in split view.
The Transcript Discovery Plugin for the CLC Genomics Workbench comes with a fully documented manual and a quick-start tutorial. The manual both documents the use of the plugin, and contains tips on how to obtain the best results by a) optimizing the sequence in which iterative analysis steps are performed and b) conducting combined versus sequential processing of multiple replicates and tissues of origin.
The quick-start tutorial provides a step-by-step guide to performing RNA transcript discovery from your RNA-seq libraries. Part of a recently published dataset (1) containing both PacBio and Illumina reads from the Wild Strawberry Fragaria vesca is provided in the tutorial, which can be used to re-annotated the reference genome. In their paper, Li et al., 2018 annotated approximately 33,000 genes using the full dataset (available from SRA). To enable users to walk through the tutorial on a broad-range of computers, we provide a link to a smaller subset of the reads. Nonetheless, these still are enough to annotated over 14,000 genes, including several new genes and transcripts that were not presented in the original paper.
The Transcript Discovery Plugin is a free add-on for the CLC Genomics Workbench that provides an easy-to-use tool-set for evidence-based RNA-seq annotation of genomes. The plugin can be downloaded and installed directly from within the Plugin Manager CLC Genomics Workbench. Alternatively, an installer file can be download from our Workbench Plugins page, where a CLC Genomics Server version of the plugin is also available.
A roomful of genomic researchers convened in San Francisco, Calif. for the first day of the sixth annual RNA-Seq Summit. If you couldn’t make it, we’ve included a few highlights to illustrate how RNA-seq is contributing to our understanding of disease biology by unlocking transcriptome information. The roster of speakers from across the country was an incredible testimony to the advances enabled by RNA-seq.
During the event, we heard from a range of speakers, including Ulrich Broeckel, MD, professor of pediatrics, medicine and physiology at the Medical College of Wisconsin, and founder and CEO of RPRD Diagnostics in Milwaukee, Wisc. Dr. Broeckel’s compelling presentation, titled “The Future Role of RNA Expression Analysis in Clinical Diagnostics,” illustrated how he uses Ingenuity Pathway Analysis to ask (and answer) “what’s next?” He uses IPA to model, analyze, and understand complex ‘omics data, enabling him to move the focus from the single “disease causing” gene to entire gene networks. According to Brockel, “The next step in precision medicine is to extend beyond the genome—to combine genomic information with functional assays and NGS expression analysis, such as RNA and miRNA.” Broeckel also proved to be an unflappable presenter: when technical difficulties interrupted his session, he gamely fielded questions and maintained his cool. We congratulate him on his excellent, well-received presentation!
Other speakers included Jin Jen, co-director of Genome Analysis Core at the Mayo Clinic, who started the day with her presentation titled “RNA-Seq as a CLIA Test for Gene Fusion Identification and Beyond.” Other Day One speakers included Bin Tian, professor and director of genome informatics at Rutgers New Jersey Medical School, whose session was titled “RNA Sequencing From the 3’ End: Methods and Implications,” and Satish Pillai, from UCSF’s Department of Lab Medicine, who focused on identifying host determinants of HIV latency using single-cell RNA-seq. The day was interspersed with speed networking, poster sessions, and interactive roundtable sessions, and we finished it out by hosting a reception for all.
We had a wonderful time in San Francisco and thank all who attended.