


In our recent white paper we describe how to investigate the functional potential of a microbial community in a polar desert in Antarctica using metagenomic shotgun sequencing data. In the original paper (1), the authors supplemented their microbiome data with qPCR analyses to investigate the expression of the most interesting genes discovered in the functional profiles to support their hypothesis that the microbial community survive by scavenging atmospheric trace gases. However, what if they had instead included RNA-seq transcriptomic data to evaluate gene activity in their samples? In this post, we show you how to add transcriptomics data to a microbiome survey using the tools of CLC Genomics Workbench.

The example below presents a de novo assembly based approach to metatranscriptomic analysis using CLC Genomics Workbench and the Microbial Genomics Module. There are, in fact, multiple approaches to performing metatranscriptomics data analysis, depending on the specific questions you may have. For a deeper review on best-practices in metatranscriptomics analysis we recommend you review Bashiardes et. al. (2), or read published examples where CLC Genomics Workbench was used for metatranscriptomics research; some recent interesting examples include a study of thehoney bee (3) and termite (4) microbiomes and their associated metatranscriptomes.
The example metatranscriptomic pipeline presented below consists of two parts (shown in Figure 1). Part 1 includes: assembling the metagenome; grouping contigs into bins to reconstruct the microbial genomes; and finding and annotating genes. It is also described in further detail in our recent white paper on Antarctic microbiome profiling. A common approach and caveat of comparing metatranscriptomes from multiple samples is often to create a “co-assembly” across your samples that serves as a single reference list of contigs and genes for the downstream RNAseq analysis. A good example of this approach can be found in Marynowska et. al. (4).
Part 2 of the analysis pipeline involves adding the transcriptomic data to supplement the metagenomic survey with information on gene activity. Part 2 is the focus of this post and will be described below.
CLC Genomics Workbench include a suite a of tools designed for analyzing gene expression data. For this blog post, we will use just only a few of them. The RNA-Seq Analysis tool will start with mapping reads to the genome and the coding sequences. The tool requires a file with the reference genome and a file with annotations for protein coding sequences (CDS) or genes. If these are not already available from Part 1 of the pipeline (Figure 1), they can be generated using Track Tools -> Track Conversion -> Convert to Tracks. This will take an annotated genome or list of contigs as input and generate individual track files. Additional details on this conversion step can be found in our manual. In this case we need to generate a track for the genome and one for the annotated coding regions. From the read mappings, reads are categorized and assigned, and expression values are calculated. The output from the RNA-Seq Analysis tool is a table describing for each gene the number of reads mapped, the number of reads per kilobase gene, and the expression value. The results can be visualized in a track list along with the genes and the read mappings (Figure 2). The track list is interactively linked to the results table, and marking a CDS of interest in the table view, will shift the focus of the track list to that particular region.

From the track view read mappings can be manually inspected by zooming in on individual genes (Figure 3). In the case of the desert soil microbiome in Antarctica, genes supporting the use of atmospheric trace gases as carbon and energy sources could be searched out from the table, and the expression values inspected.

If your microbiome investigation involves comparing microbial communities at different times or under different conditions, transcriptomes can be compared across multiple states. This analysis can be performed with the tool Differential Expression for RNA-Seq. The tool performs a statistical test of the differential expression of two or more samples. The output is a table displaying for each gene, the fold change and the p-value for the statistical comparison. From this list, genes significantly changing expression levels under different biological conditions can be found.
CLC Genomics Workbench contain several additional tools for analyzing RNA-Seq data for more sophisticated comparisons and visualizations than what have been shown here. If you are interested in learning more or trying out the functionalities, you can always download a free trial.
When investigating the composition of microbial communities, researchers often need to calculate and visualize the diversity within and between samples, often referred to respectively as the alpha and beta diversity of samples. Based on feedback from our users, we have added several new data visualization options for microbial diversity in the latest release of CLC Microbial Genomics Module (version 4.5), which are described in more detail below.
With QIAGEN’s CLC Microbial Genomics Module, we provide a number of different metrics for estimating the alpha diversity, including Total Number of OTUs, Chao 1, Simpson’s index, Shannon entropy, and the phylogenetic diversity. The choice of index for an analysis often depends on the underlying experiments and the dataset itself, but often a resulting alpha diversity estimate for a single or multiple samples is visualized with line graph similar to a receiver operator curve. Based on feedback from our users, we have included in the latest release of CLC Microbial Genomics Module (version 4.5) the ability to also represent alpha diversity of a sample using box plots. This new functionality has been integrated into the existing tool for calculating alpha diversity, and the box plots will be generated automatically when running the tool Alpha Diversity.
In the examples below, we used the same data from our recent white paper on the microbial diversity in a polar desert in Antarctica. Alpha diversity, estimated as the total number of OTUs at the taxonomic level of Order, is displayed in a line graph on the left and as a box plot on the right. In the left figure all samples are shown and colored by location, but any desired metadata parameter could have been chosen. In the box plot on the right, samples have been grouped by location. Individual data points and outliers can be displayed, as well as indicators for mean and median. Groups can be compared with a Kruskal-Wallis test and the p-values for any pairwise comparison displayed above the plot (as shown). In the example of the Antarctica microbiomes, the microbial diversity was significantly higher in the Dry Valleys soil as compared to the saline water in Ace Lake (p = 0.03), and the microbial diversity was significantly lower in the Dry Valleys soil as compared to the marine sediment at Adelie Basin (p = 0.03).

CLC Microbial Genomics Module also provides several different metrics for estimating the beta diversity in a set of samples, including Bray-Curtis, Jaccard, Euclidean, and UniFrac. The latest release now enables users to display beta diversity in either a 2D or 3D PCoA plot. Below is shown the beta diversity among samples from different locations in Antarctica. On the left, the beta diversity is visualized in the existing 3D PCoA plot, and on the right, the diversity is visualized in the new 2D PCoA plot. The new 2D PCoA plot will be generated automatically when running the tool Beta Diversity. The data can be sorted and displayed with any user defined metadata. In the example below, data points are colored by location. As evident from both graphical representations, the microbial communities in Antarctica are clearly separated by geographic location.

There are several new features in the latest release of CLC Microbial Genomics Module. If you haven’t already done so, upgrade your installation today to take advantage of these new visualizations simply by opening. If you are new to CLC Genomics Workbench or the CLC Microbial Genomics Module, you can download the software with a free 14-day trial license here.
Enjoy!
Microbiome research presents us with an opportunity to study all microorganisms on Earth. Nonetheless, many are difficult to isolate in the lab and remain uncultured using traditional microbiology methods, despite more than 100 years of research into developing new cultivation methods. Unraveling the currently undiscovered biodiversity of microbiomes remains a major challenge in microbiology, and it is estimated that more that 99% of all microbes remains uncharacterized by traditional culture methods (1). Just 20 years ago, in 1998, Handelsman first proposed to analyze a soil microbial community without prior cultivation (2). The use of culture-independent metagenomics approaches grew rapidly once the advantages became clear, with just one publication listed in PubMed in 1998 to now more than 11,000 publications.
Metagenomic sequencing is a powerful approach to investigate the microbial diversity of complex samples, with taxonomic classification of organisms sometime reaching strain level precision. Shotgun metagenomics can not only reveal specific organisms in a sample, but is also a powerful approach to characterize the functional genomic profile encoded within microbiomes, and potentially to discover genes with new functions. Although the specific sample preparation, library preparation, and sequencing platform used are all important factors that influence the quality of your results, ultimately the downstream bioinformatics pipelines and reference databases used become the analysis bottleneck. With this last point in mind, we have released a new white paper describing how to carry out functional genomics characterization of unbiased shotgun metagenomics data using CLC Genomics Workbench and the add-on CLC Microbial Genomics Module.
To demonstrate the broad capabilities of our software, we re-analyzed previously published data from Mukan Ji and co-workers (3). Ji et al investigated the surprisingly diverse microbial soil community of a polar desert in Antarctica and sought to understand how these microbes survive in such a harsh and nutrient deficient habitat.
For an in-depth discussion of the study and their exciting findings, we recommend listening to the podcast with microbiology experts Vincent Racaniello, Michael Schmidt, Elio Schaechter, and Michelle Swanson on This Week in Microbiology, TWiM. The paper was discussed in Episode 169 – Breatharian Bacteria.
Read our white paper on functional metagenomics with CLC Genomics Workbench and the Microbial Genomics Module and learn how to reveal the functional potential of microbiomes sequenced using shotgun metagenomics methods.
Microbes play essential roles in human, animal and plant health. Knowing the composition and diversity of a microbial community is the first step in understanding microbe-microbe and microbe-host interactions, revealing key players in health and disease and discovering major modulators. Next-generation sequencing in microbiome research has accelerated data generation and changed our perception of the complexity and structure of microbial communities. However, microbiome data sets are typically high-dimensional, adding further complexity to data analysis and processing.

In our white paper, “Characterizing the Microbiome through Targeted Sequencing of Bacterial 16S rRNA and Fungal ITS Regions,” we demonstrate the power of the CLC Microbial Genomics Module for investigating complex microbial communities.
We used the original data of Purahong et al.’s work from the April 2016 edition of Molecular Ecology “Life in the leaf litter: novel insights into community dynamics of bacteria and fungi during litter decomposition,” to analyse amplicon sequencing data for profiling microbial communities via clustering reads into operational taxonomic units. Purahong’s study explored the dynamic interplay of bacteria and fungi during leaf degradation over a one-year period in response to fluctuations in nutrient availability.
We demonstrate how the usage of our pre-configured CLC workflows can ease analysis on-boarding, reduce hands-on time, and ensure consistency and reproducibility in microbiome analyses.
Purahong W, et al. (2016). Life in the leaf litter: novel insights into community dynamics of bacteria and fungi during litter decomposition. Molecular Ecology 25, 4059.
With CLC Microbial Genomics Module 2.0, you can now identify microbes with strain level accuracy in metagenomics data. Check out the release highlights here. The module is part of our QIAGEN CLC Genomics ProSuite which fully equips you with all the tools you need for whole genome-driven pathogen typing, epidemiological analysis of outbreaks and microbiome profiling.
You may also find our webinar on Monday, April 17 of interest: Taxonomic Profiling using Shotgun Metagenome Data
You can register here!
Microbial communities contribute more than half of all the cells our bodies are composed of. And not surprisingly, the taxonomic and genetic makeup of microbiomes is closely linked to the health of humans, animals and plants.
Yet especially the functional genetic composition of microbiomes is hard to establish and current metagenomics tools struggle with correctly predicting functional composition or changes in function between microbiome samples [Lindgreen et al. 2015].
What if you could access tools to de novo assemble metagenome data, reliably predict functional elements, and identify statistically significant changes in function between samples? And what if these tools were fully integrated into the industry standard for scientist-friendly NGS data analysis, and came along with a toolbox that has been optimized for microbiologists?
CLC Genomics Workbench, CLC Microbial Genomics Module and the MetaGeneMark plugin deliver superior performance, a fully integrated user experience and come bundled at a competitive price.
Accuracy of results
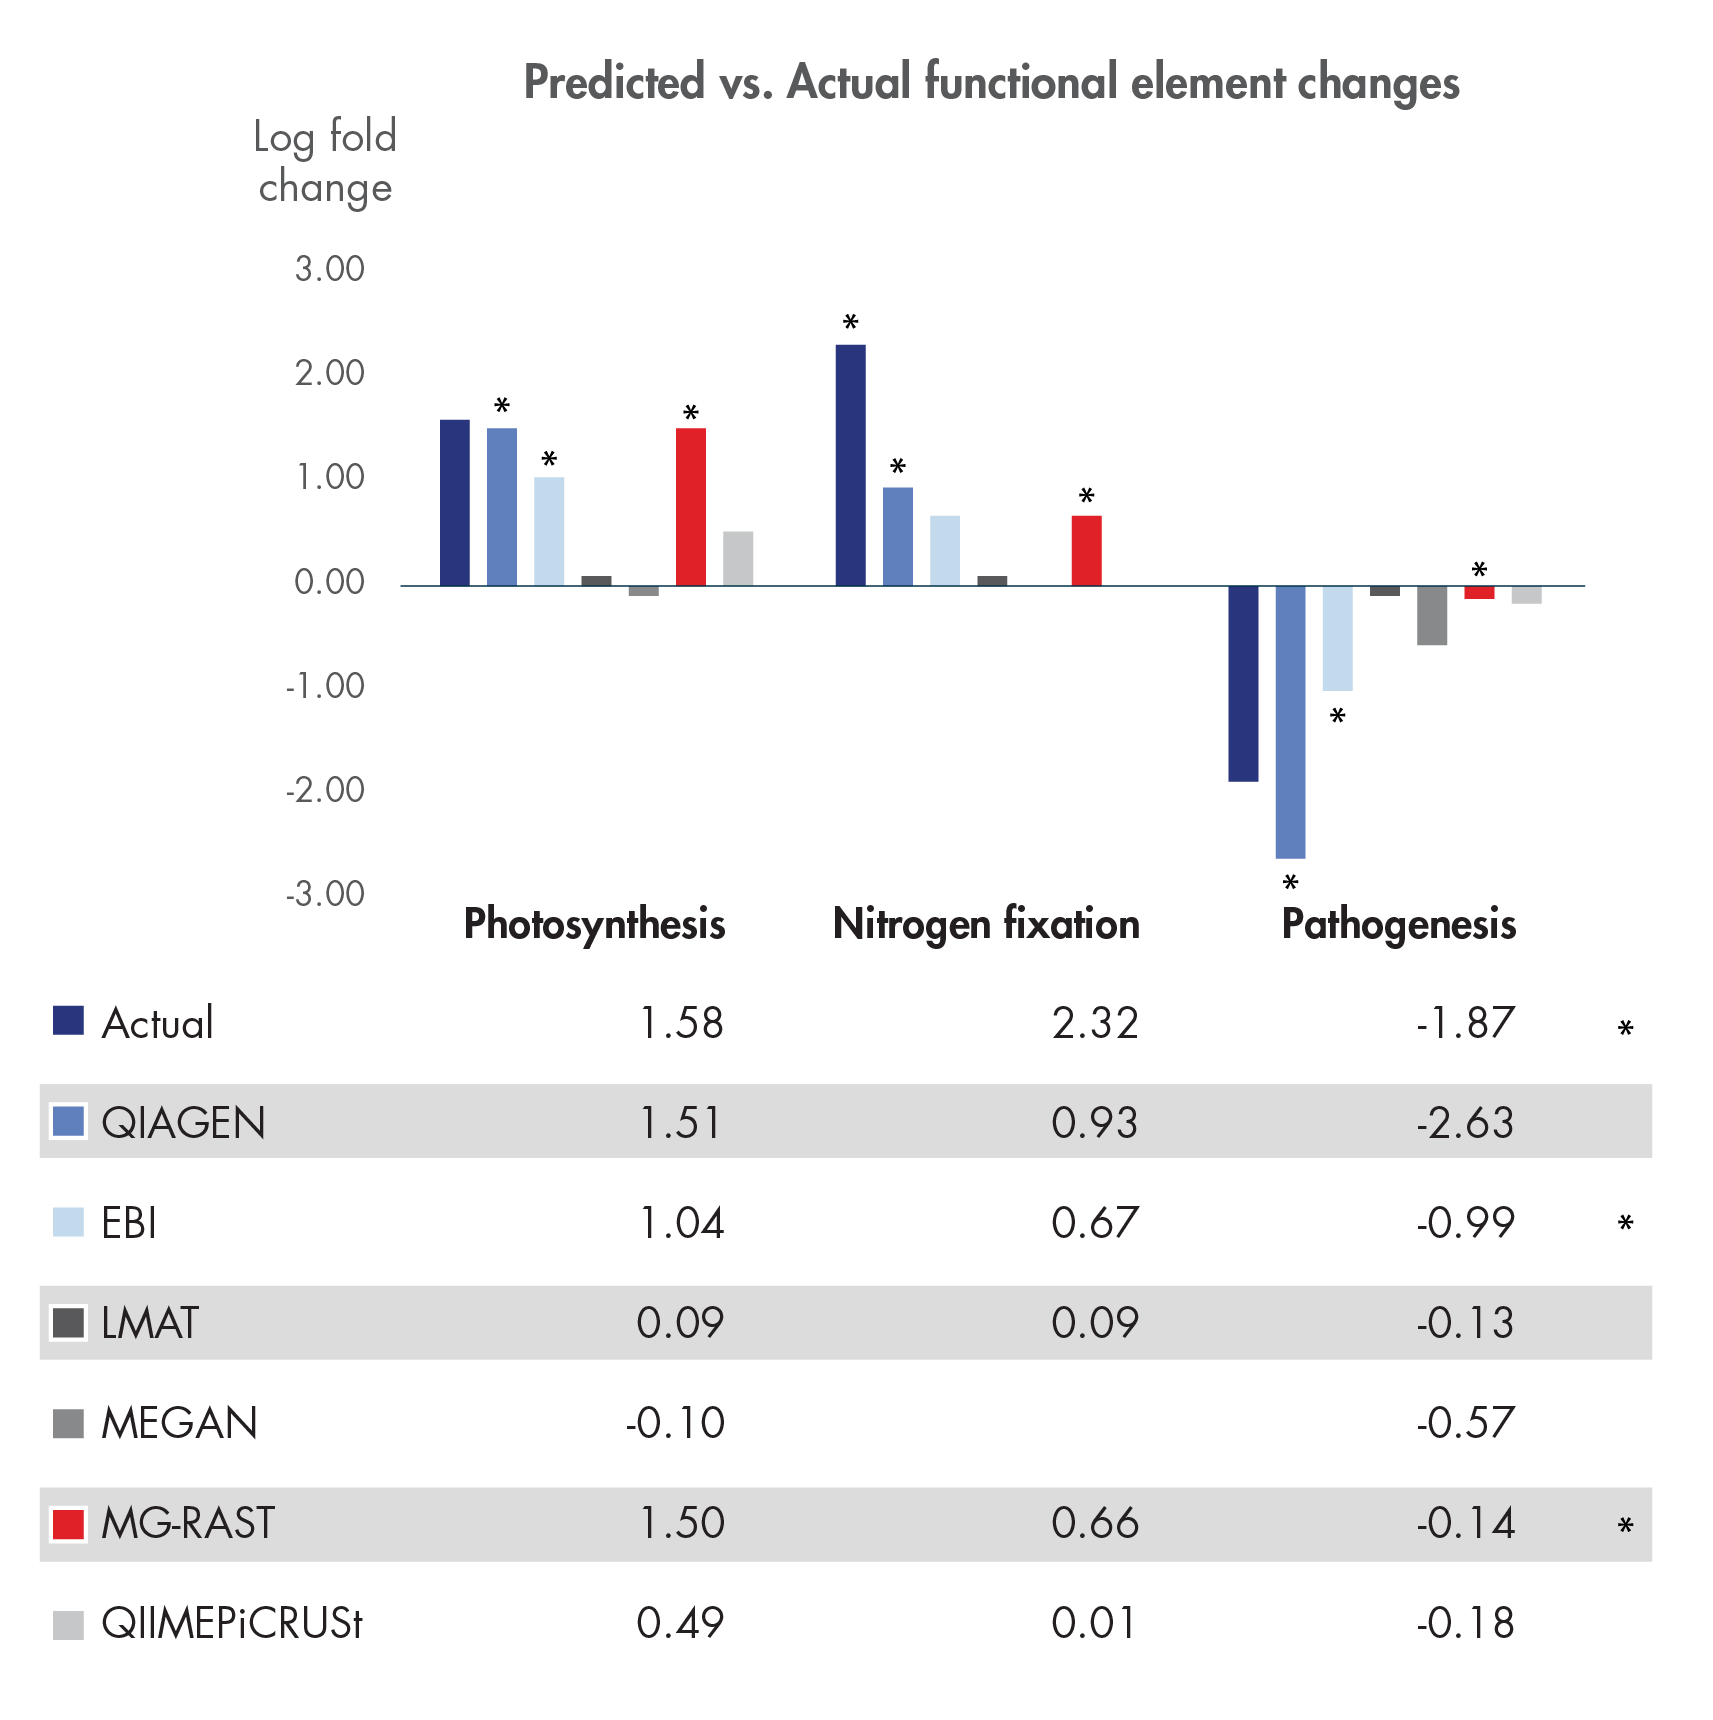
Figure 1. Assigning and tracking gene function in metagenomes with confidence.
Lindgreen et al. published a comprehensive, independent evaluation of 14 different whole metagenome analysis toolkits in Nature Scientific Reports in January 2016. We here compare our solution to the sole five toolkits out of the fourteen that allow functional metagenome analysis using the test data published by Lindgreen et al. Statistical comparison (Edge test performed in CLC Genomics Workbench) of pairwise differential abundance of the individual functional elements predicted in the two test communities detects a statistically significant difference for all of the three functional elements that were analyzed in the paper: photosynthesis, nitrogen fixation and pathogenesis (all p-values < 0.01). Fold-changes predicted using our tools capture the expected overall pattern of functional changes and estimate the actual fold-change with higher precision than any other tool in all three functional roles.
* indicates tools that consistently predicted changes correctly with statistically significance.
Detecting gene function in microbial communities based on metagenomic data is hard. Correctly measuring changes in the functional makeup between different metagenome samples is even harder.
Lindgreen et al. showed that most of the benchmarked open source tools failed to correctly predict such changes at levels that are statistically significant.
With our solution for microbial genomics you can more accurately detect and quantify functional elements in a sample. And the included statistical tools allow you to confidently measure statistically significant changes in function between samples.
Multi-sample comparison is used to detect functional changes between samples and to identify samples with similar or diverging functional genomic elements. Data can be grouped and analyzed in the context of your sample-metadata.
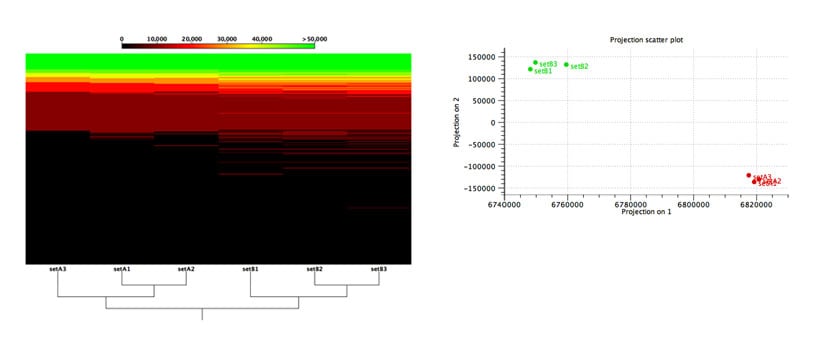
Figure 2: Functional comparison across microbiome samples.
Evaluation of an algorithm’s capabilities in detecting functional changes in metagenomes is notoriously hard because the ground truth is unknown and there exist no gold-standard datasets. To overcome these difficulties, Stinus Lindgreen et al. created six datasets from two synthetic microbial communities for his benchmarks: three (A1, A2 and A3) from the A community and three from the B community. To control the functional content, he created the two communities, A and B, with a selected set of species with known functional capabilities: Cyanobacteria (photosynthesis), Bradyrhizobium (nitrogen fixation) and Rhizobium (nitrogen fixation) were more abundant in community A, while a set of known pathogens where more abundant in community B.
As shown in Figure 2, our tools were able to reliably separate samples from the two different communities based on the relative abundance of their predicted functional content.
Our accurate assignment of gene function depends on a novel metagenome assembler producing higher quality assemblies compared to leading alternatives. Table 1 illustrates how our metagenome assembler compares favorably when it comes to misassemblies, InDels, mismatch errors, and other quality metrics.
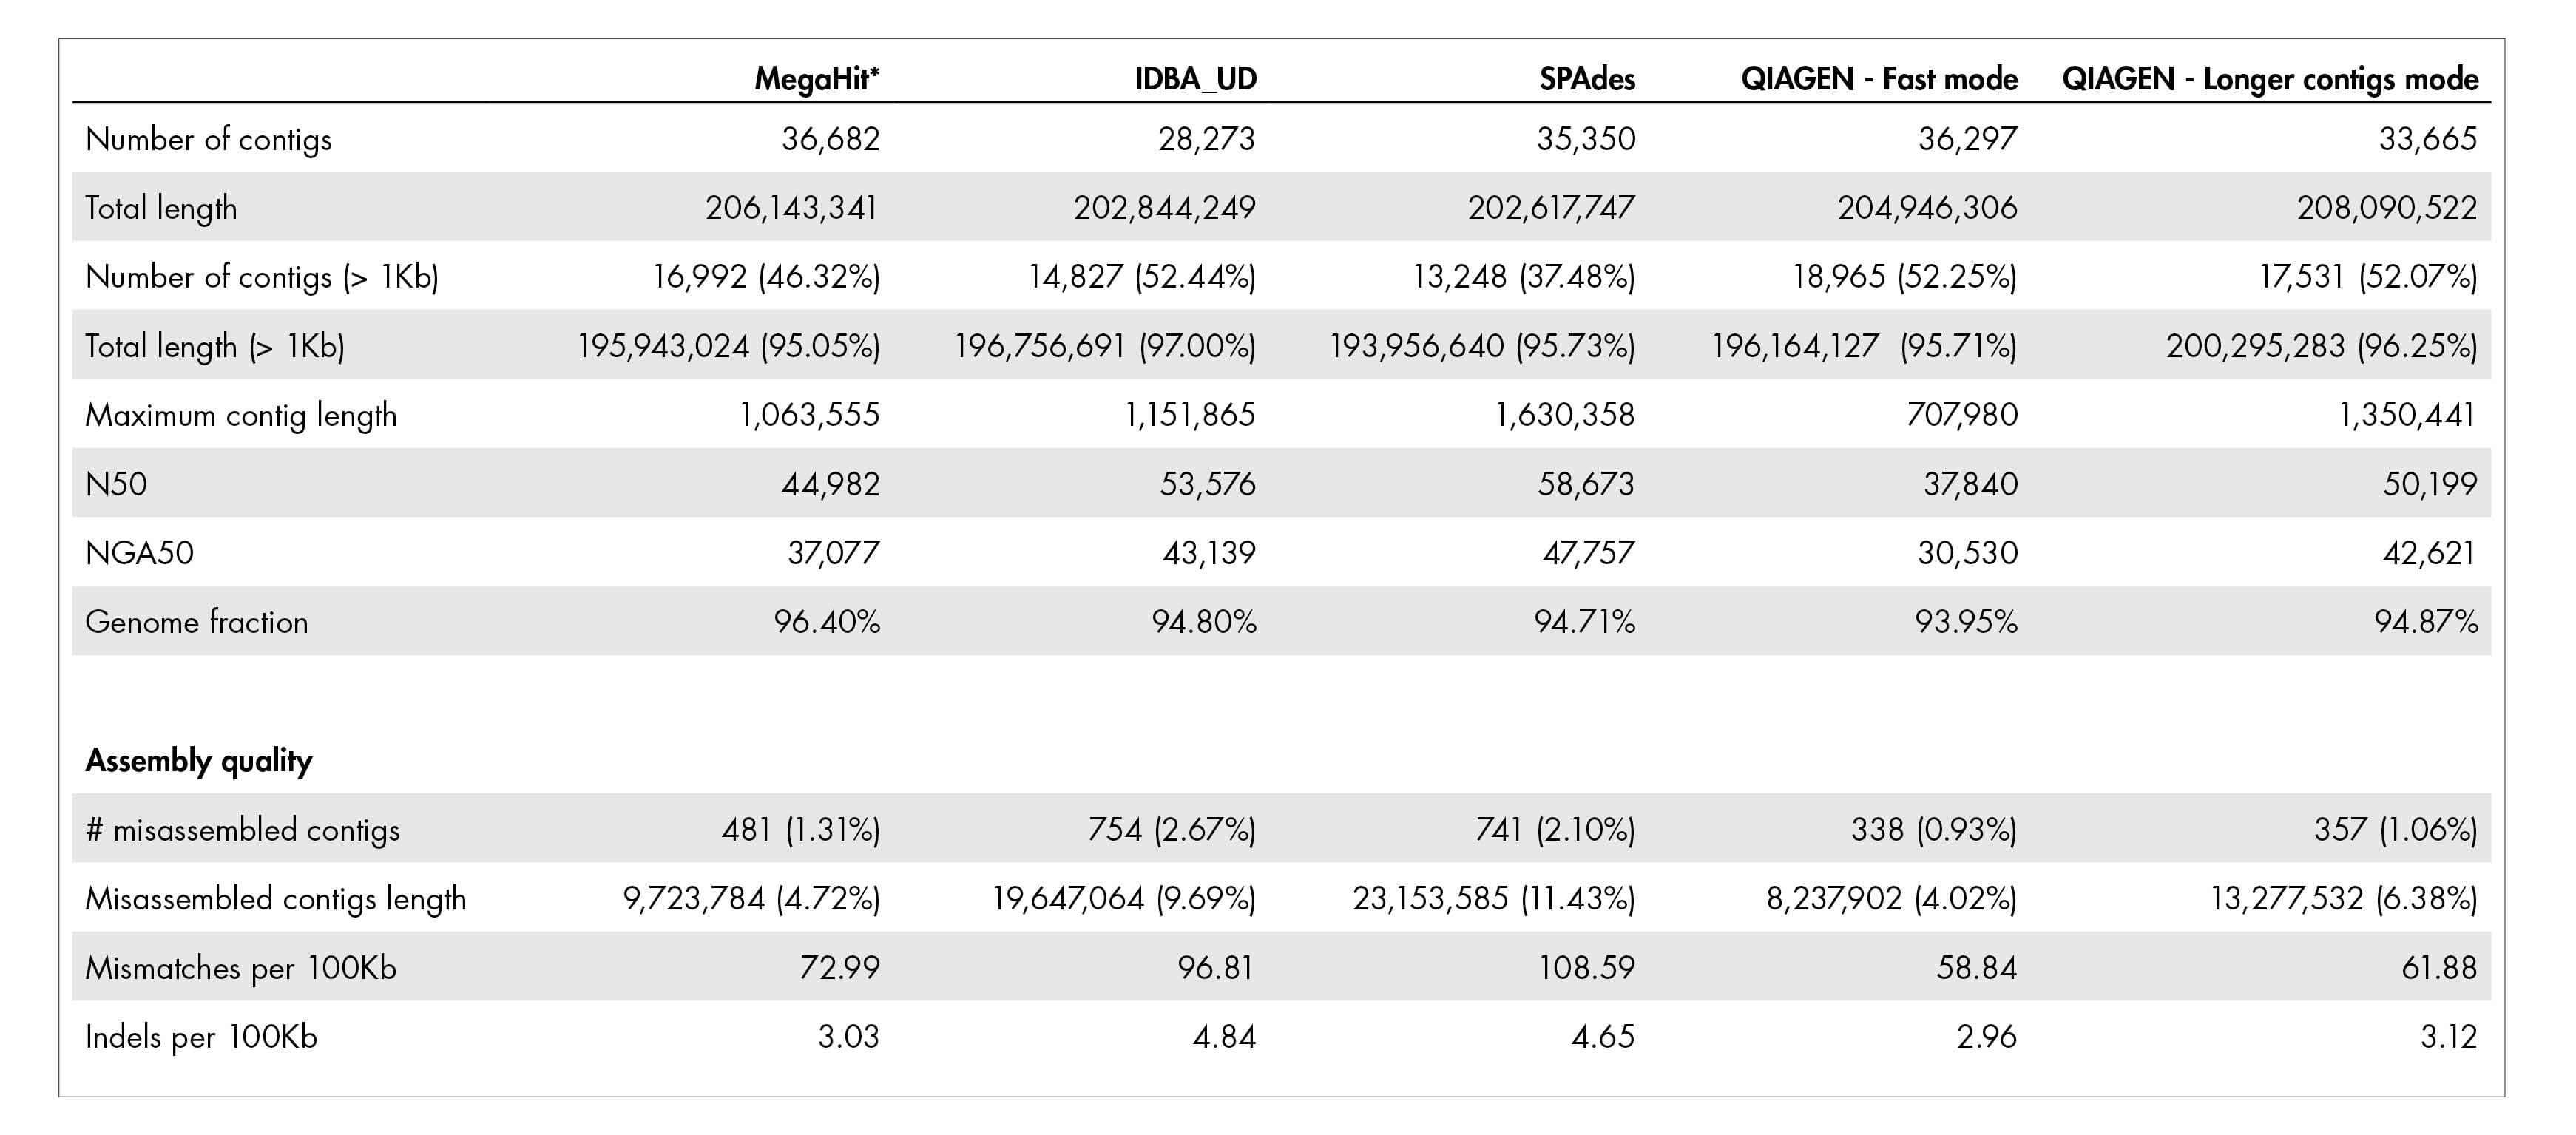
Table 1: Quality of metagenome assembly.
The QIAGEN metagenome assembler delivers superior assembly quality resulting in more accurate annotation of functional genetic content. A dataset published by Shakya et al. 2013 was used for this benchmark. The actual number for “Total length” and “Total length (>1kb)” should be close to 209,845,413 bases.
Run time and compute resource requirements are important when sample volume is high.
We have benchmarked the metagenome assembler included in our microbial genomics solution against leading metagenome assemblers using a dataset by Shakya et al. 2013. Shorter run time and greater compute resource efficiency was consistently demonstrated compared to other leading assemblers.
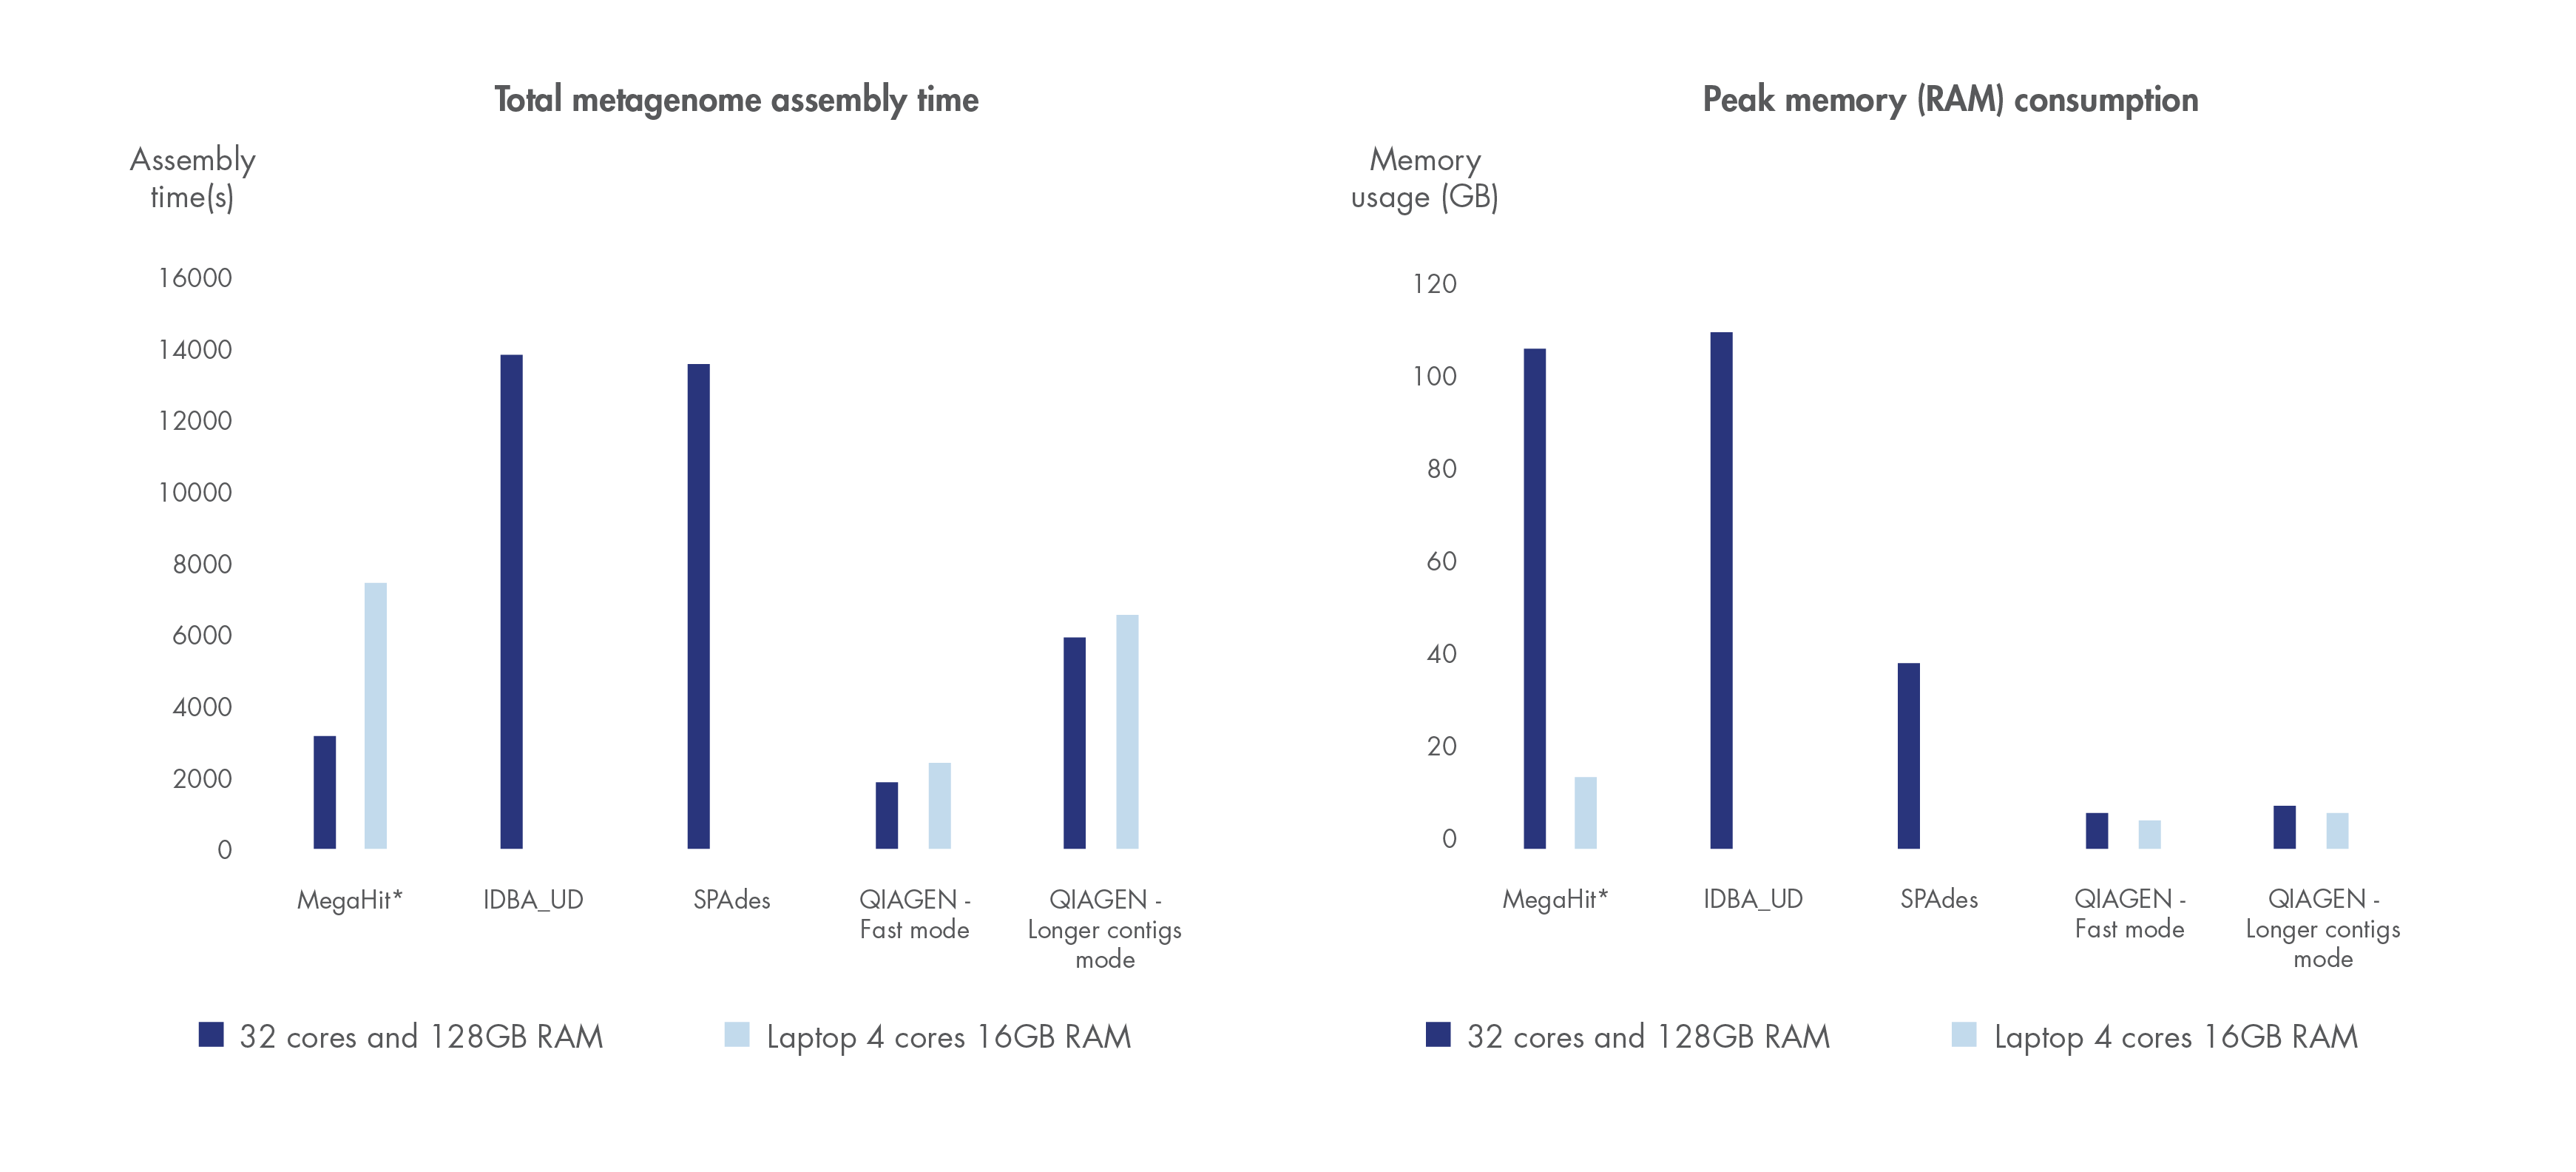
Figure 3. Best in class metagenome assembly.
Accelerated algorithms result in metagenome assembly that outcompetes leading alternatives in run time and compute resource consumption. *Note that MegaHit is able to scale its memory consumption down by sacrificing run time.
Increase walk away time
To increase walk away time, users can use the Workflow feature in CLC Genomics Workbench to combine the analysis steps 2 through 7 listed below into a preconfigured one-click workflow. Workflows are capable of batch processing many samples increasing walk-away time.
Analysis steps in functional metagenomics workflow:
1 → Import of multiple whole metagenome sample read datasets and association of metadata to each sample.
2 → QC and trimming of whole metagenome reads.
3 → De novo assembly of each sample read dataset into high-quality contigs using the new De Novo Assemble Metagenome tool.
4 → Locate coding sequences (CDS) in the resulting contigs using the third-party MetaGeneMark genefinder plugin for the CLC workbenches.
5 → Annotate CDSs with Gene Ontology (GO) terms and Pfam protein families or Best BLAST Hits using one of the two new tools, Annotate CDS with Pfam or Annotate CDS with Best BLAST Hit, respectively.
6 → Map the input reads back to the annotated contigs using the built-in Map Reads to Reference tool in the CLC workbenches.
7 → Build a functional abundance profile of each sample using the Build Functional Profile tool
8 → Merge the functional abundance profiles for all samples into one profile using the Merge Functional Profile tool.
9 → Visualize the individual and merged functional abundance profiles, perform filtering based on abundance, and apply the different options for showing the abundance profiles in the context of metadata.
10→ Perform hierarchical clustering and statistical analysis based on the relative abundance of functional elements in the samples.
Find out more about our microbial genomics solution